IMPULSE LAB
By: Vincent Mele,
Partners: Max Mccandless, Kyle Higgins
2-26-14
By: Vincent Mele,
Partners: Max Mccandless, Kyle Higgins
2-26-14
Purpose:
The purpose of this lab is to verify that the momentum change of an object is equal to the objects impulse using friction-less carts on a track with a force meter.
The purpose of this lab is to verify that the momentum change of an object is equal to the objects impulse using friction-less carts on a track with a force meter.
Theory:
The change in momentum of an object is defined as that objects impulse. To calculate change in momentum one must multiply an objects mass and velocity together. An alternate way of determining an objects impulse is by using the area under the curve method which is that impulse will equal the area under the curve of a force vs. time graph. No mater which way you prefer to determine the impulse whether calculating it or finding the area under the curve the results should be equal.
The change in momentum of an object is defined as that objects impulse. To calculate change in momentum one must multiply an objects mass and velocity together. An alternate way of determining an objects impulse is by using the area under the curve method which is that impulse will equal the area under the curve of a force vs. time graph. No mater which way you prefer to determine the impulse whether calculating it or finding the area under the curve the results should be equal.
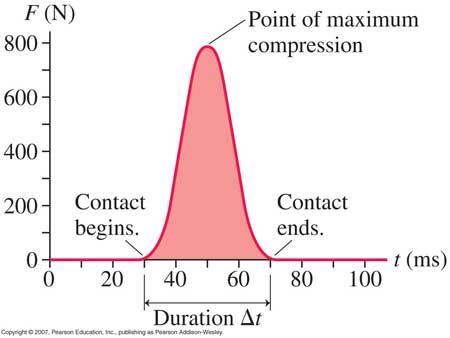
Impulse=Area Under Curve=∆P
∆P=m∙∆v
∆P=m∙∆v
Experimental Technique:
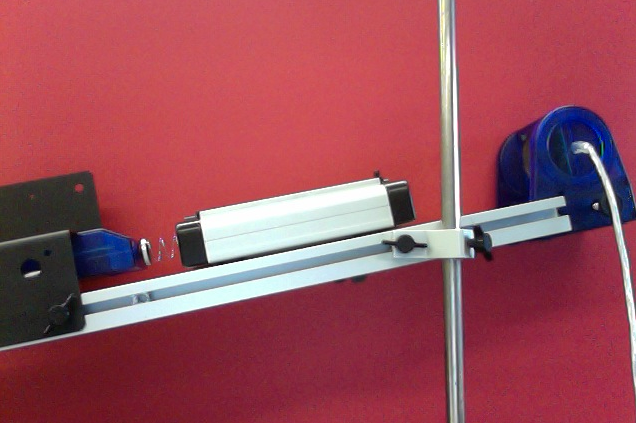
- Construct testing apparatus, as shown below, using: inclined plane, standing rod, brackets, friction less cart, motion sensor, force sensor, week spring, strong spring, rubber stopper, magnet.
- Attach ether week spring, strong spring, rubber stopper, or magnet to force sensor and zero the device once attached.
- Prepare a force verses time graph in data studio and get ready to begin recording data.
- Begin recording data via data studio and drop the friction less cart down the inclined plane and let it hit the force sensor.
- Do not exceed 50N on force sensor when doping cart because this amount of force will break the sensor.
- Observe data studio recording data on the velocity vs. time graph as the cart makes contact with the force sensor.
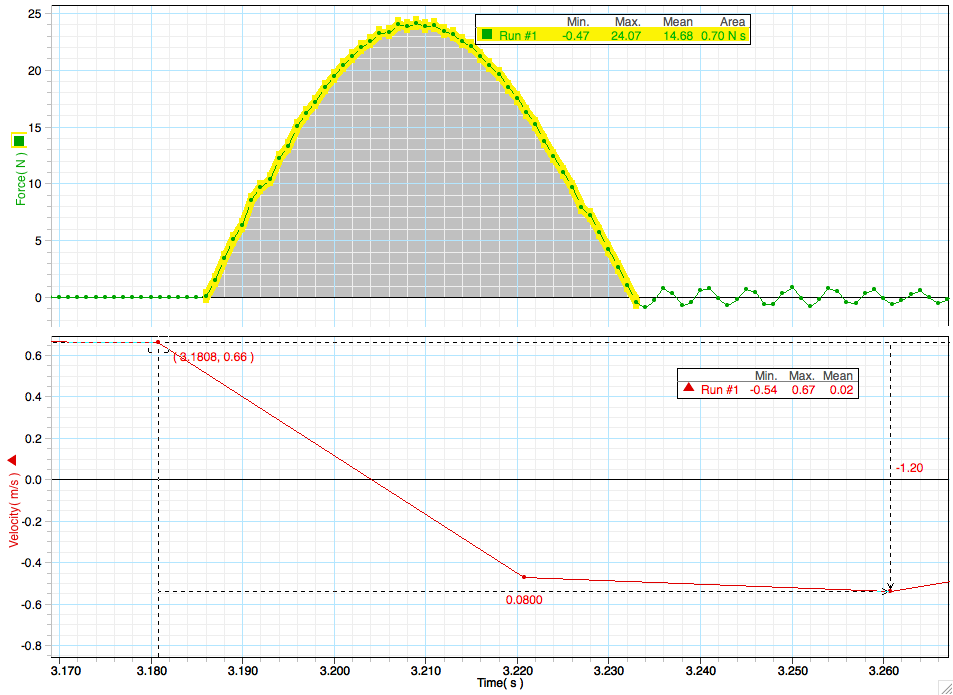
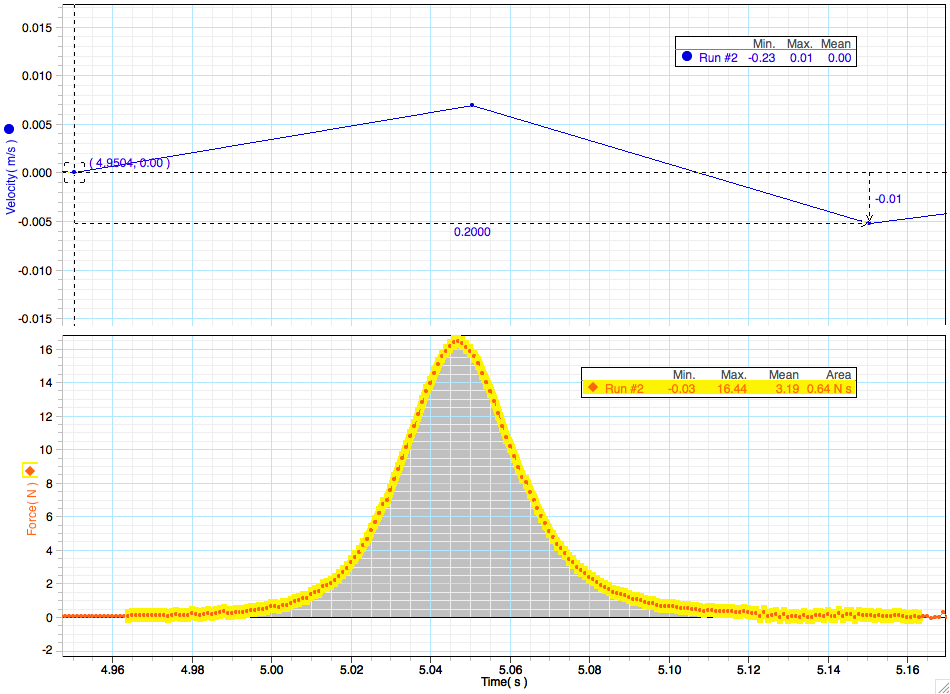
- Now use the abilities of data studio to calculate the area under the curve of the force vs time graph.
- Calculate the momentum not using data studio and compare this to the area under the curve.
- Finally repeat steps 2-8 but replace whatever you originally attached into the force sensor with something not previously used.
- Remember to always record your data and findings.
Data & Analysis:
Big Spring
Magnet
|
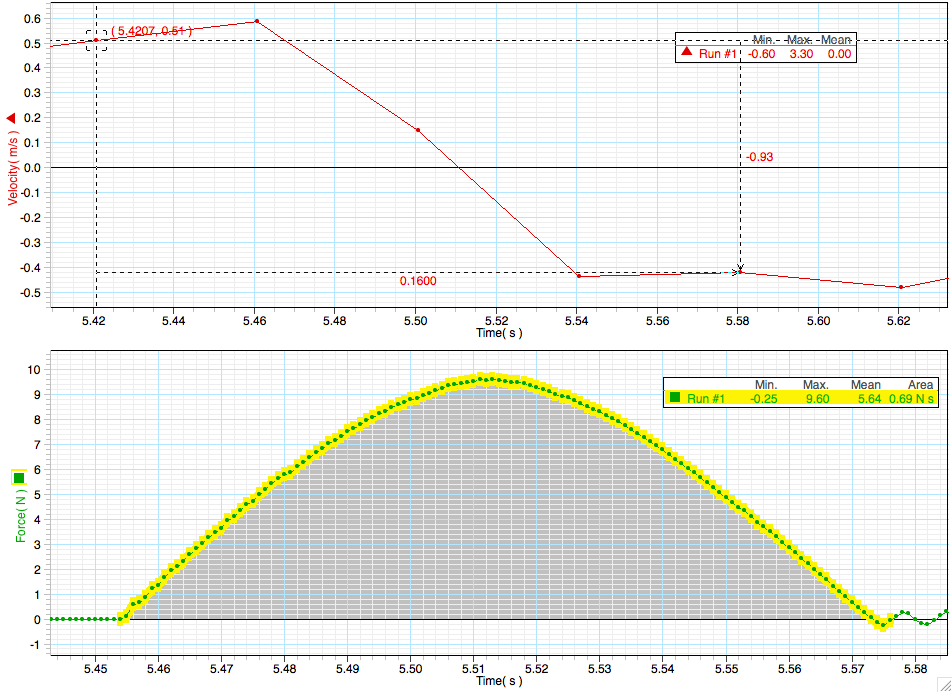
Small Spring
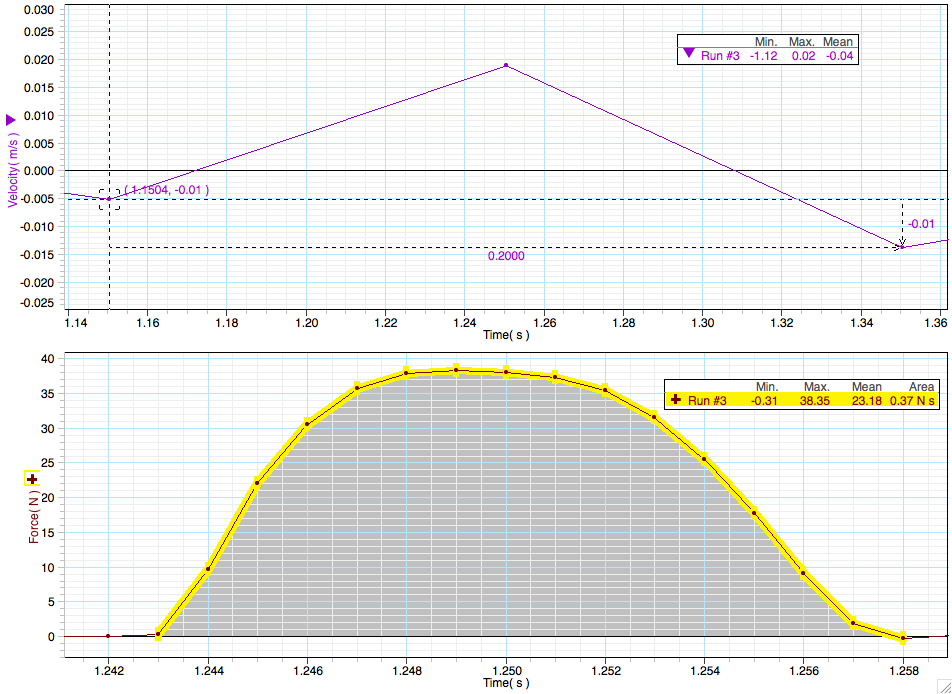
Rubber Stopper
|
∆P=m∙∆v
∆P=0.508kg∙0.93m/s
∆P=0.472 (kg∙m)/s
∆P=0.508kg∙0.93m/s
∆P=0.472 (kg∙m)/s
Conclusion::
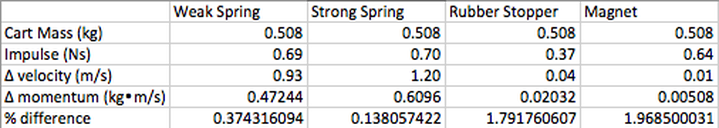
Impulse can be defined as the change in momentum of an object or the mass of the object times that objects velocity. It can also be defined as the area under the curve of a velocity vs. time graph. This lab set out to verify this with all the data we had collected. While comparing the area under the curve of the graphs with the calculated impulse we discovered that they did not correlate very well at all. We suspect that possibly the motion sensor was having a rough time correctly reading the velocity of the cart as it rolled down the plane. The inconclusive readings could be attributed to other things like damaging of force sensor or possibly incorrect readings by data studio due to the fact that the impact was in such a short time period Based off of the data we collected the only conclusion that could be made is that this experiment has disproved that mass times velocity of an object equals the area under the curve of that objects velocity vs. time graph.
Impulse can be defined as the change in momentum of an object or the mass of the object times that objects velocity. It can also be defined as the area under the curve of a velocity vs. time graph. This lab set out to verify this with all the data we had collected. While comparing the area under the curve of the graphs with the calculated impulse we discovered that they did not correlate very well at all. We suspect that possibly the motion sensor was having a rough time correctly reading the velocity of the cart as it rolled down the plane. The inconclusive readings could be attributed to other things like damaging of force sensor or possibly incorrect readings by data studio due to the fact that the impact was in such a short time period Based off of the data we collected the only conclusion that could be made is that this experiment has disproved that mass times velocity of an object equals the area under the curve of that objects velocity vs. time graph.
